

The Storm Chasers' Spring Chase Outlook
What does tornado season look like for the rest of Spring?

We’re already, unfortunately, off to a deadly and strong start for tornadoes across the Plains. But a busy start does not mean things end that way, nor does it mean that it won’t…end that way.
I prepared this outlook before the tornadoes at the start of March, but I haven’t had to change much because the activity has been well within what I expected for the year thus far. Hopefully, I can continue to look and feel smart through the spring.
Editor’s Note: This is the text version of our seasonal forecast for storm chasing. I initially released this to our YouTube channel members as a video over a month ago. Click here to join.
Executive Summary
Every year around this time, I sit down with months of data — climate models, analog years, sea surface temperatures, drought maps, jet stream forecasts — and try to answer a question that the atmosphere doesn’t want answered: what kind of tornado season are we in for?
It’s an important exercise for someone like me who needs a framework to guide decision-making when I take valuable PTO to chase vs. when I should save that time off for the next setup.
This year, the data is telling a surprisingly coherent story. An ENSO transition is underway, the Gulf of Mexico remains above average (at or near its 2023 peaks), and a stubborn upper-level ridge is threatening to sit on top of or just west of Tornado Alley during the months that matter most. But buried underneath the big-picture signals, there are hints of a late-season pattern shift that could make the back half of this season genuinely interesting — if you know where to look and you’re willing to wait for it.
What follows is my full breakdown: the forces shaping the season, what each month is likely to bring, where the action will be (and where it won’t), and how I’m planning to approach chase season. Spoiler: Patience is going to be a virtue this year.
What’s Driving This Season
Three forces are working against us early on, and one big wildcard could rescue the back half.
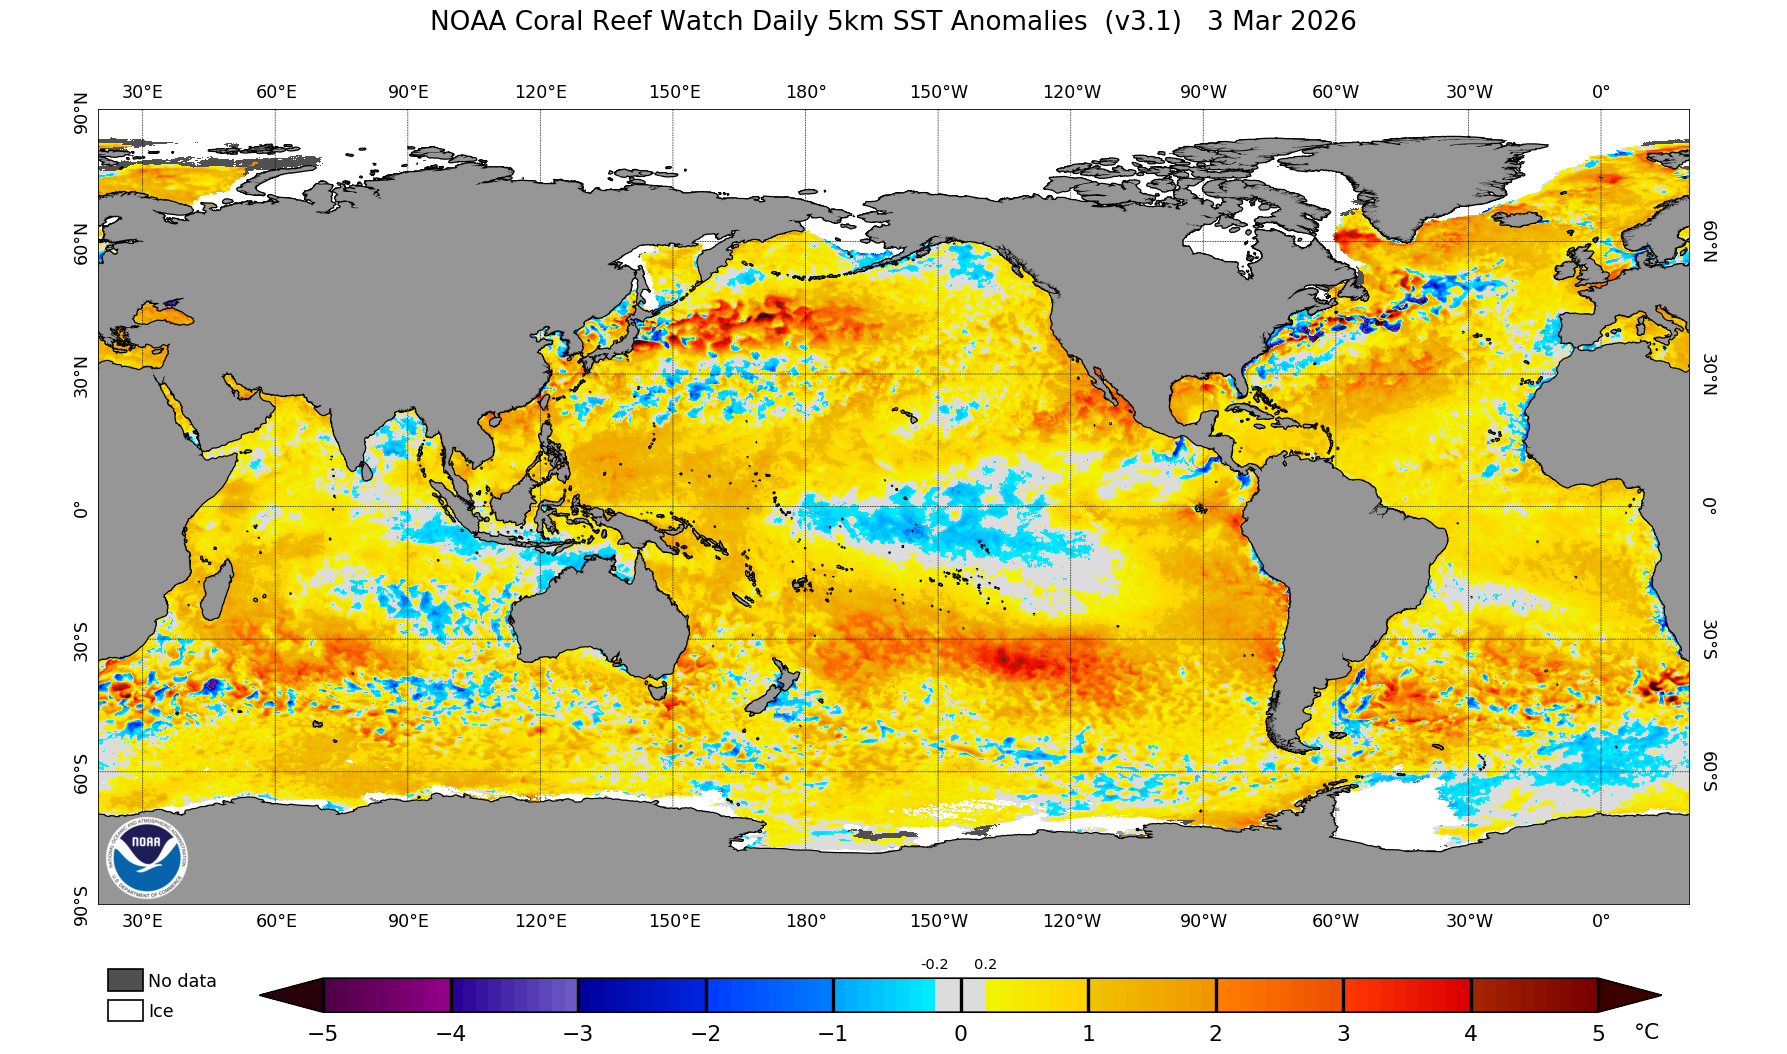
The ENSO Transition. We’re coming out of La Niña right now, with the Niño 3.4 index sitting near -0.8°C. But underneath the surface, things are changing fast. Massive Kelvin wave activity in the western Pacific is pushing warm water eastward, and the subsurface warming trend is accelerating. I was expecting the CPC to get more aggressive with their El Niño calls and I wasn’t disappointed. I think the transition is happening fast and may be complete by summer. That transition is the single most important variable for how this season ends.
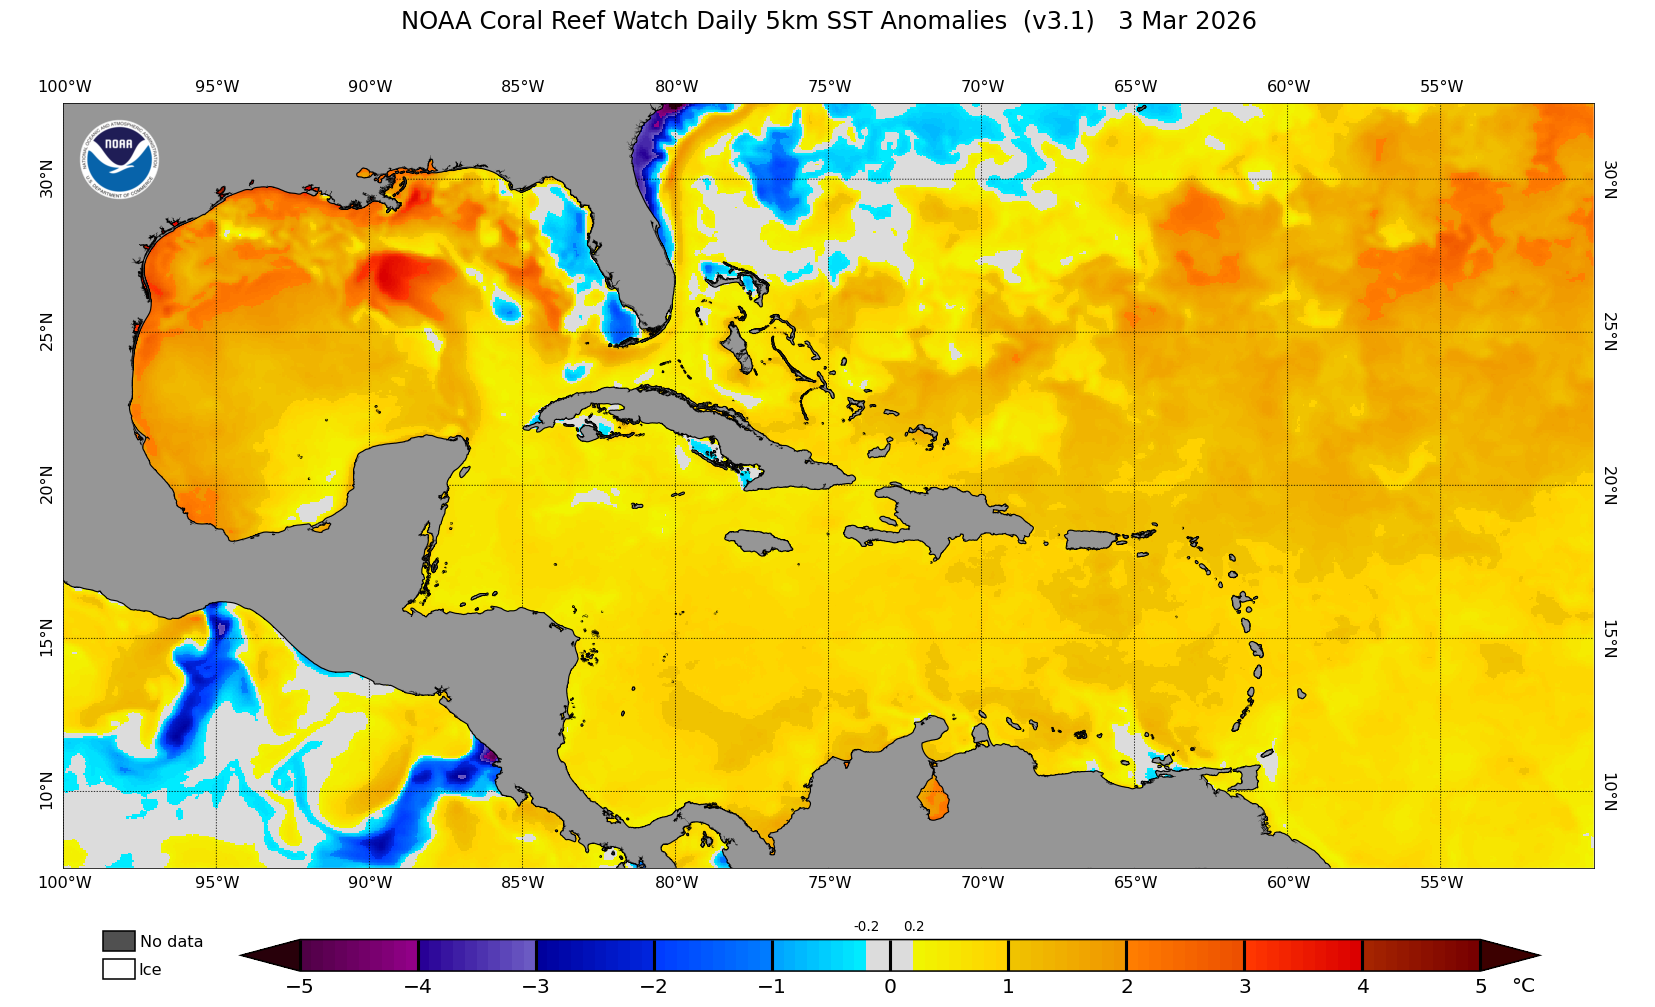
The Gulf of Mexico. Gulf SSTs are currently running a whopping +1.5°C above normal or so! The Gulf cooled substantially through late January but have since rebounded with record warmth. When compared to a recent analog year of 2023, you’ll see the Gulf is pretty comparable right now, but the key will be where it goes from here. Models hint at a couple of strong fronts passing through the Gulf in the next week — which will cool it some. Most likely it will end up above average but perhaps not to the scale of 2023, when record-warm Gulf temperatures fueled that insane March 31 outbreak. If the Gulf remains near record warm, I will get pretty bullish about April — but models have had those pretty significant frontal intrusions which may put a cap on what the Gulf can reasonably warm to. Still, it’s well above average which means when we get systems moving into the Plains they won’t struggle with moisture from the south.
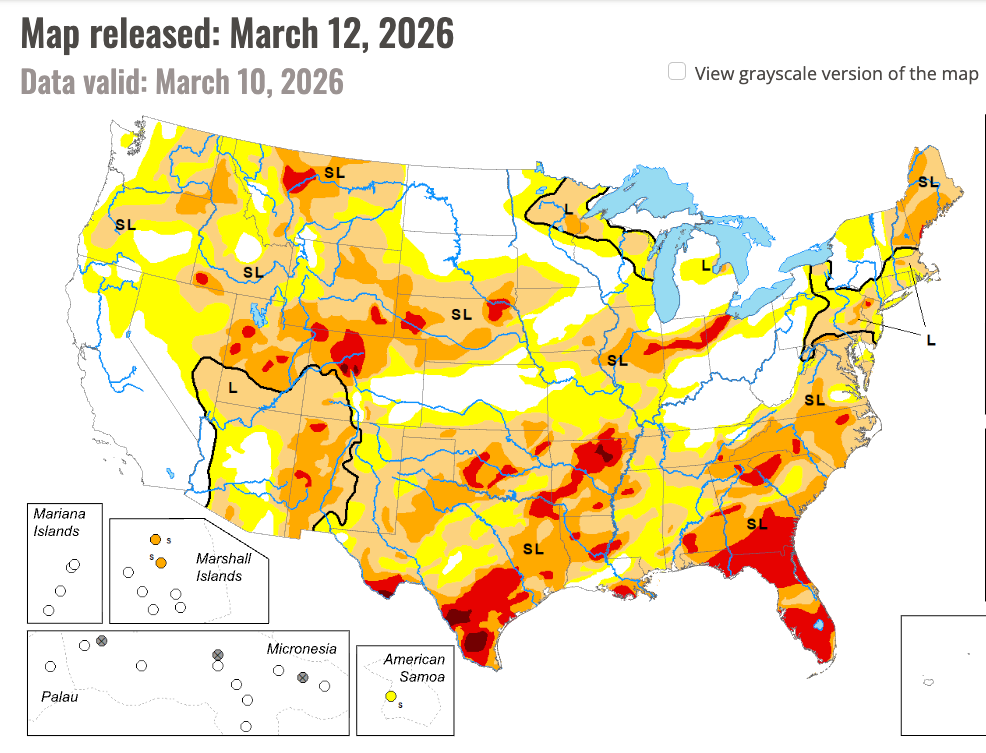
The Drought. D2 through D4 drought covers nearly the entire southern Plains, Gulf States, and Deep South. CPC’s seasonal drought outlook shows it persisting through at least the end of April. Dry soils mean less evapotranspiration, which means the boundary layer becomes almost entirely dependent on direct Gulf moisture return, which is a bigger (but not impossible) ask. With the hot/dry air over the high terrain of New Mexico up through Montana, the direct result becomes strong capping (which we’ve already seen), steep lapse rates (again yep), and an atmosphere that produces several ‘loaded gun’ setups throughout the Spring.
The Ridge. Climate models have tended to show continued ridging over the western/central U.S. through at least April, with positive height anomalies easing in May and June. That’s a monster cap and area of sinking air sitting right on top of Tornado Alley during what should be the ramp-up month. We’re seeing that ridge build right now over the Southwest. It’ll be a factor much of the Spring. Models have the ridge shifting west by May, partially opening the door, and relaxing significantly by June. That progression is the roadmap for the season.
Month by Month
Rest of March: Mixed Signals
The pattern overall looks like a strong ridge builds in with lots of cold air to the east and repeated frontal intrusions into the Gulf. This will make things very difficult in terms of getting severe storms across the country until at least March 22-23, if not longer. Any real activity probably shifted into the Southeast US and later in the month from here to be sure. We will end at/near average if things don’t pick up in a big way.
April: Patience Required
The ridge is at peak strength over Tornado Alley in April, according to climate models. My read right now is that most of April will feel empty. But here’s the thing — multiple analog years produced a notable burst in late April with multiple days of solid chasing occurring as the ridge breaks down and a trough punches through. In fact, one analog year (2009) produced a high risk tornado outbreak in late April! I will chase in this month most likely, but I’m going to be patient and wait for the Southern Plains to get active to be sure.
May: The Slog
This is where the season gets frustrating/interesting/a bit of both. Every analog year shows a below-average May but not an entirely quiet May. The subtropical jet brings in those 30-knot 500mb winds with 15-knot 850s — enough shear to make you say “well, maybe” but not enough to organize anything impressive. You’ll see supercells initiate off the dryline, struggle with the cap for hours, and then either gust out or produce a brief spin-up before dying. If you chased in 2023, you know this feeling intimately. I think the pace of chase days will pick up dramatically as the month goes on with near daily chasing by the end of the month. Nothing BIG RISK, but just a slow and steady drumbeat day after day. I like those patterns personally as they make for productive storm chasing.
June: The Rescue Month
This is where it gets interesting. Every analog year shows above-average June tornado activity. As El Niño establishes, the subtropical jet energizes, the ridge relaxes, and moisture return from the Gulf finally has a flow regime it can work with long-term. The geographic sweet spot shifts to the High Plains and central Plains — think an L-shaped corridor from eastern New Mexico/Panhandles up through southeast Wyoming and east into Nebraska. If the ENSO transition cooperates, expect a sustained burst of chase-worthy activity with the potential for a big day or three in there.
July: The Overlooked Extension
Here’s something most seasonal outlooks miss: July was above average for tornadoes in every single analog year. Some years it even surpassed April in total activity. The season doesn’t end on June 30. If El Niño is humming by midsummer, northern Plains supercells could extend the window well into July.
An Important Sidebar: Tornado Intensity
One consistent and notable signal across the analogs: fewer strong and violent tornadoes than normal. One analog year even produced zero EF4/5 tornadoes nationwide. This isn’t random — it’s a function of the subtropical jet regime. You get adequate mid-level shear but weaker low-level jets because deep surface cyclogenesis is suppressed. That combination produces supercells but limits the low-level rotation needed for significant tornadoes. Expect the vast majority of this year’s tornadoes to be EF0–EF1. That doesn’t mean violent tornadoes are impossible, but the physics of flow regimes work against them.
Hot Zones and Cold Zones
🔴 Hot Zone: Nebraska, Northern/Western Kansas, Eastern Colorado, and SE Wyoming
Less drought, favorable positioning on the ridge periphery, and the primary beneficiary of the June–July pattern transition. This is where the season happens in a big way if El Niño delivers.
🔴 Hot Zone: Eastern Oklahoma through the Mid-Mississippi Valley
Early-season QLCS events and embedded supercells when the jet streams through ahead of shortwave energy. I’m thinking April for this region will be more active. The dryline will set up further east than normal, and fire weather on its backside will be epic — very reminiscent of 2009. We’ve already seen this pattern a bit earlier this month.
🔵 Cold Zone: Far Northern Plains (Dakotas)
Last year was a bonanza up here, but this year’s engine is the subtropical jet, not the polar jet. Canada might be active, but the Dakotas are unlikely to repeat 2025’s performance.
⚡ Wildcard: Southern Plains
Some analog years show a concentrated 3–4 day burst here in late May or June — enough to make it look like a hot zone in hindsight. The analog year I’m warming up to (1997) was a big year on the Southern Plains with consistent activity in May and June. If the pattern briefly cooperates and the dryline sets up in its climatological sweet spot, this area could help tip the mood about this chase season as one that was pretty active even if the numbers don’t reflect it totally.
The Chase Season in a Sentence
Be opportunistic early, be patient through May, and be ready to go north and west when June arrives.
The Final Verdict
This is going to be a near average to slightly below average tornado season — but absolutely not a quiet one.
The first half of spring will test your patience as a storm chaser. The second half might reward it. The most likely scenario is a slow start, a steady pickup through May, and a legitimate burst of activity beginning in late May or June as El Niño emerges.
A near-average finish is very much in play if June and July deliver, which is why that category sits at 50%. And the 10% above average? That’s my floor — because it only takes one pattern to lock in for a week to cluster up 200 tornado reports, and I’ve been doing this long enough to never say never. The downside risk is real, though. If the subtropical jet is weaker than anticipated, we may still get a steady stream of chase days but few actual tornadoes in the heart of the season.
Outlook Probability
Above Average (15% or more above normal): 10% chance
Average (Within 15% of normal): 50% chance
Below Average (15% or more below normal): 40% chance