

The Radar Deep Dive: 3 Products Beyond the Basics
Go beyond just using reflectivity and velocity with these three radar products!

If you’re new to following severe weather, you likely already know the basics of reflectivity and velocity. A hook echo makes sense to you—but why one storm explodes into the “storm of the day” while the one next to it fizzles is often a mystery. The answer is usually hidden in the next layer of radar products. Let’s look at three tools every severe weather watcher should have in their kit.
The Severe Weather Masterclass: The Basics of Forecasting LIVE
Join us on Saturday, January 17, at Noon CT live on YouTube for the first class in our winter education series. All of these will be FREE to attend thanks to our generous members.
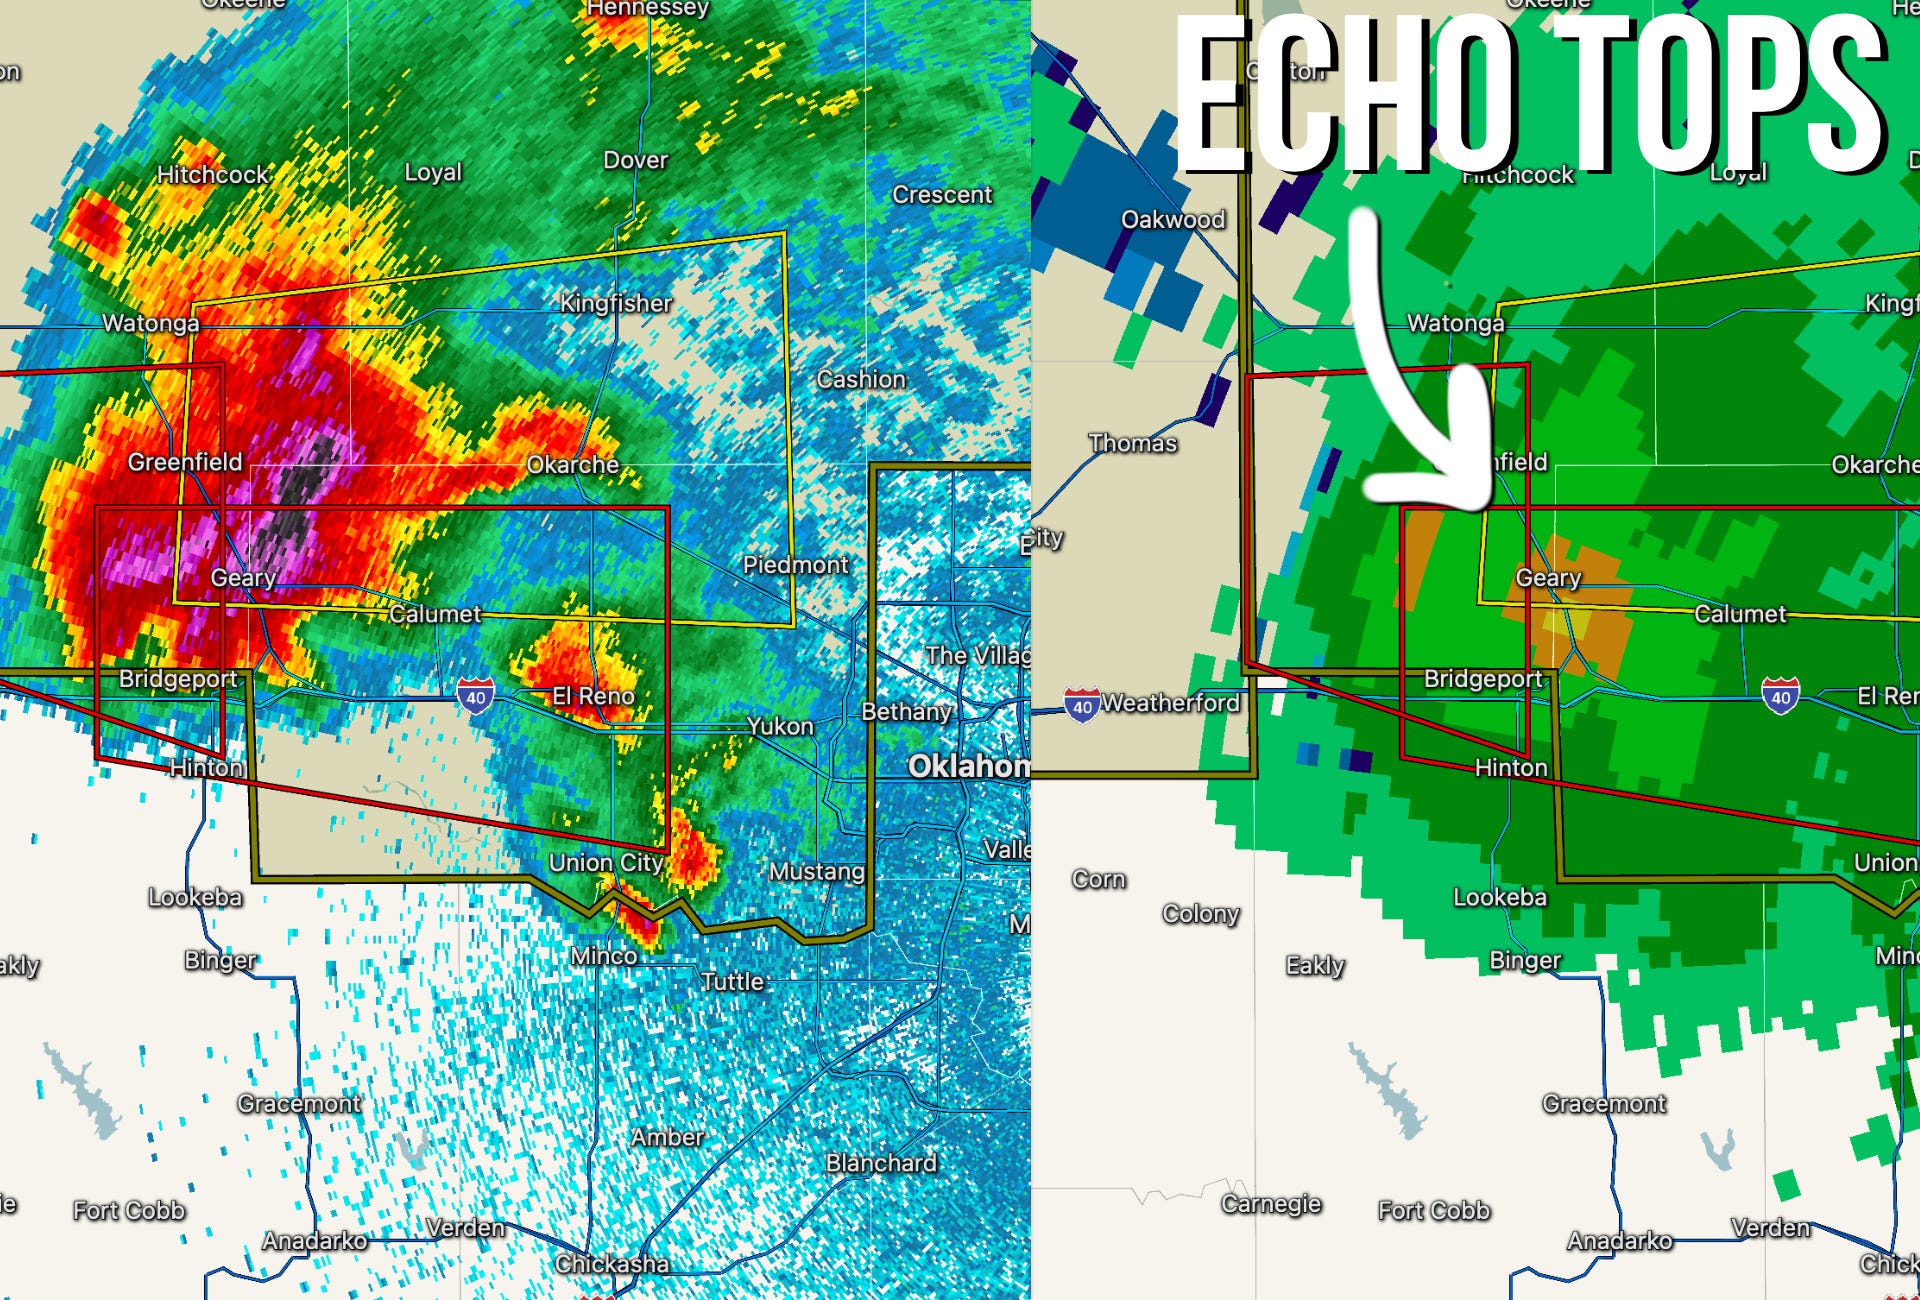
1. Echo Tops: Know Which Updraft Is More Powerful
The Big Picture: Echo Tops (ET) tell you the height of the storm. It’s the “growth chart” of a storm’s updraft.
Why it Matters
Echo tops help you separate the contenders from the pretenders. It identifies where the most intense vertical motion is actually occurring. Storms with higher echo tops than those around them are often the most likely severe-weather producers.
The Field Use-Case: Storm Triage
The Scenario: You have three cells firing along a dryline. They all look like classic kidney beans on reflectivity.
The Move: Switch to Echo Tops. If Cell A is at 38,000ft and Cell B is at 52,000ft, Cell B is the one that’s going to produce severe weather more quickly.
The Deep Science: The Overhanging Vault
The “Pro” Signal: Watch for the highest Echo Tops to be offset from the highest base reflectivity.
Why? This indicates a powerful, tilted updraft. If the tops are directly over the core, the storm is likely “pulse-y” or vertical. If the tops are displaced from the highest reflectivity numbers, the storm is organized and venting efficiently.
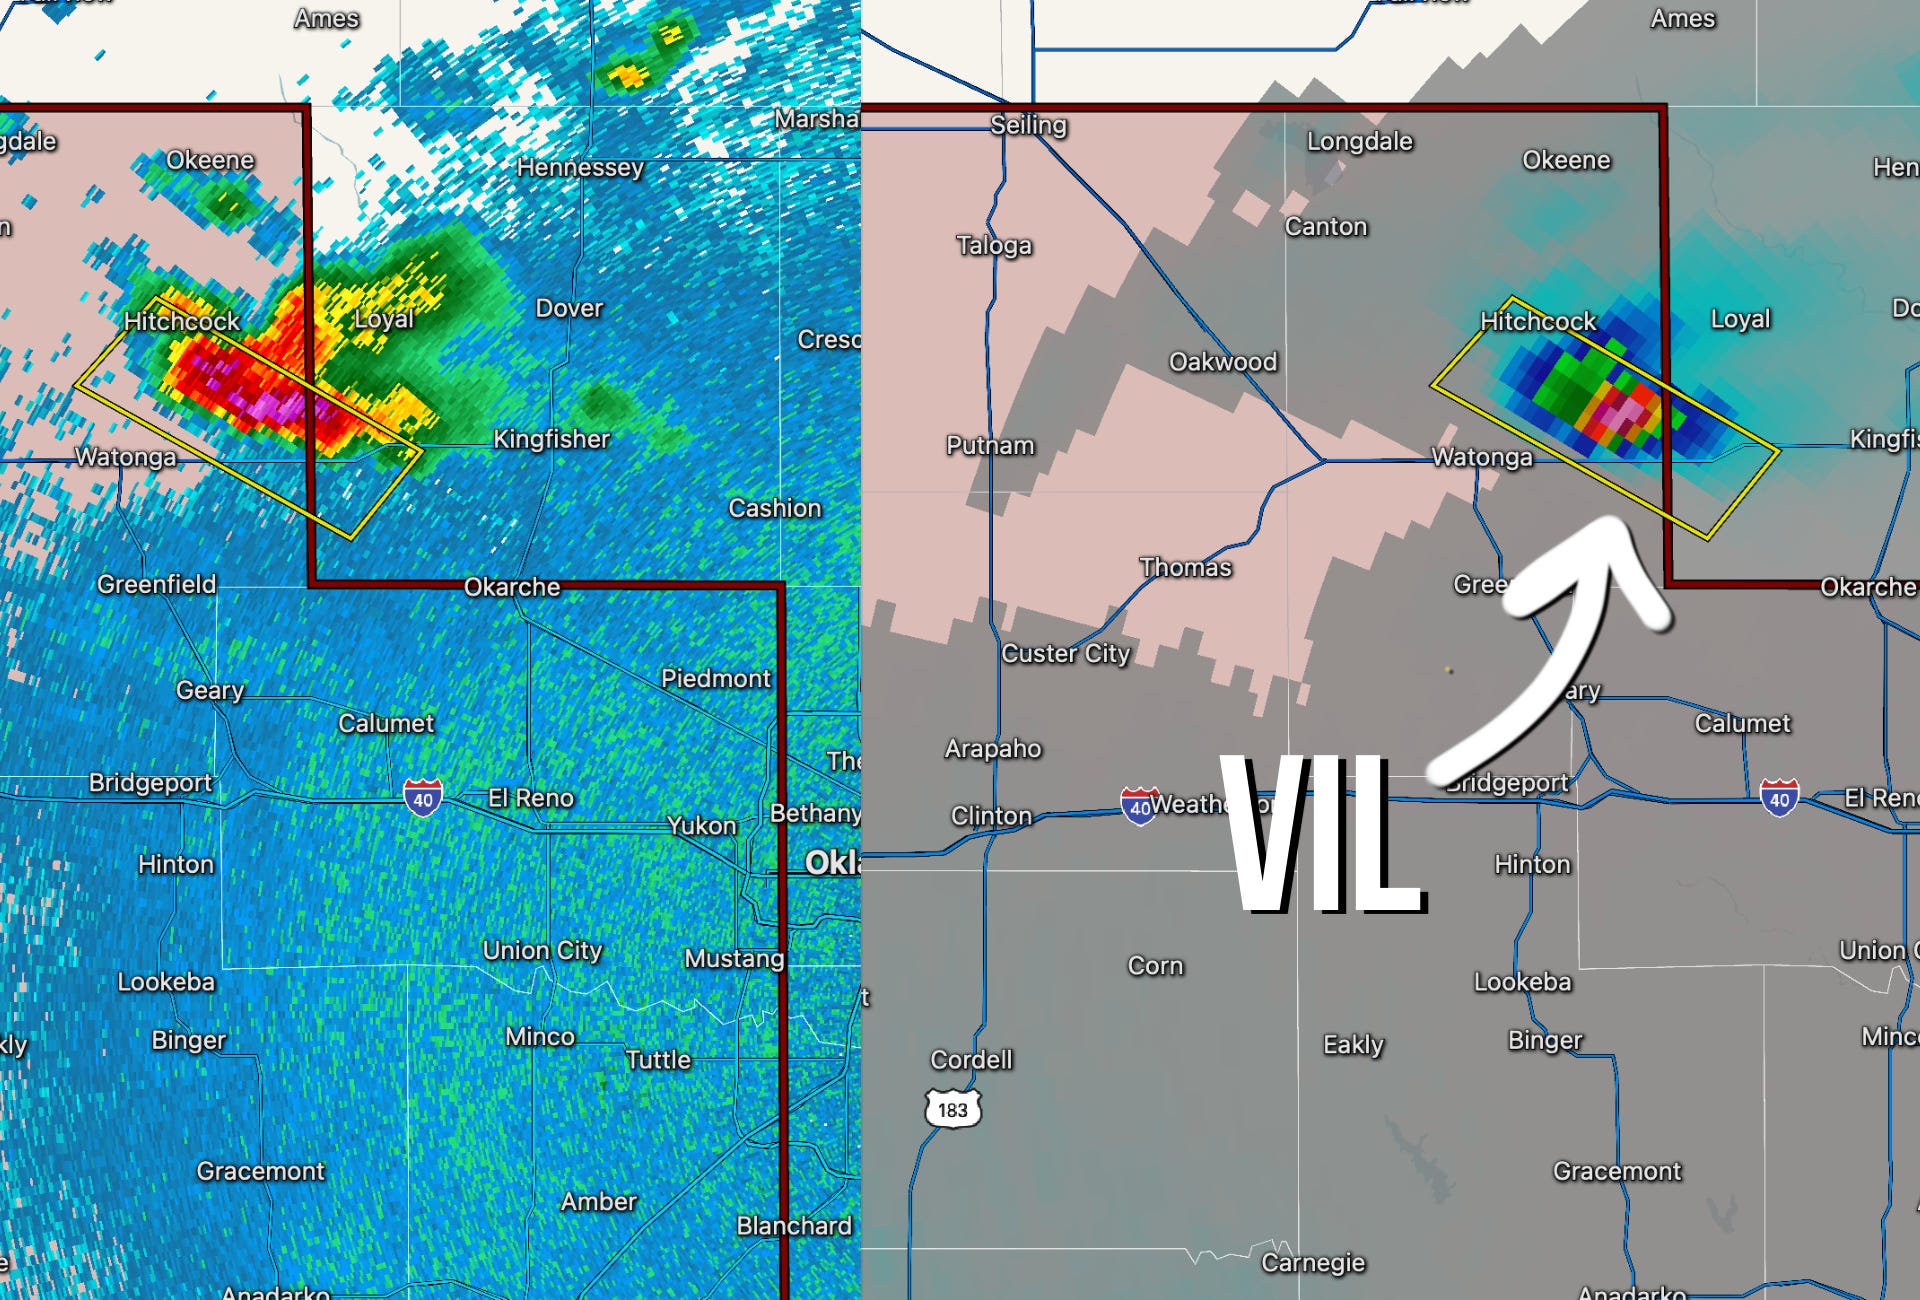
2. VIL: Taking the Updraft’s Pulse
The Big Picture: Vertically Integrated Liquid (VIL) isn’t just a “hail-o-meter.” It represents the total mass of water and ice being held aloft by the updraft,, and it’s way more helpful than just identifying where hail is likely to fall.
Why it Matters
Reflectivity can be deceptive (hail can make a small storm look “huge”). VIL tells you the actual volume of the core. More importantly, it tells you when a storm may be about to diminish quickly.
The Field Use-Case: The Core Collapse
The Scenario: A mature supercell is ongoing in the early evening hours. Reflectivity is still a solid 65 dBZ.
The Move: Monitor the VIL trend. If the VIL begins to “tank” (drop rapidly) while reflectivity remains high, the updraft has lost its ability to hold the water/ice up.
The Result: This is the signal that a storm may be on the downswing, and it may happen quickly.
The Deep Science: The Range Trap (Beam Broadening)
The “Pro” Signal: Don’t trust VIL values at face value when a storm is more than 80-100 miles from the radar.
The “Why”: Radar beams aren’t laser-thin; they spread out as they travel (a phenomenon called beam broadening). At 100 miles away, the beam is nearly 2 miles wide. This means the radar is “smearing” the storm’s intense 70 dBZ core with the surrounding lighter rain.
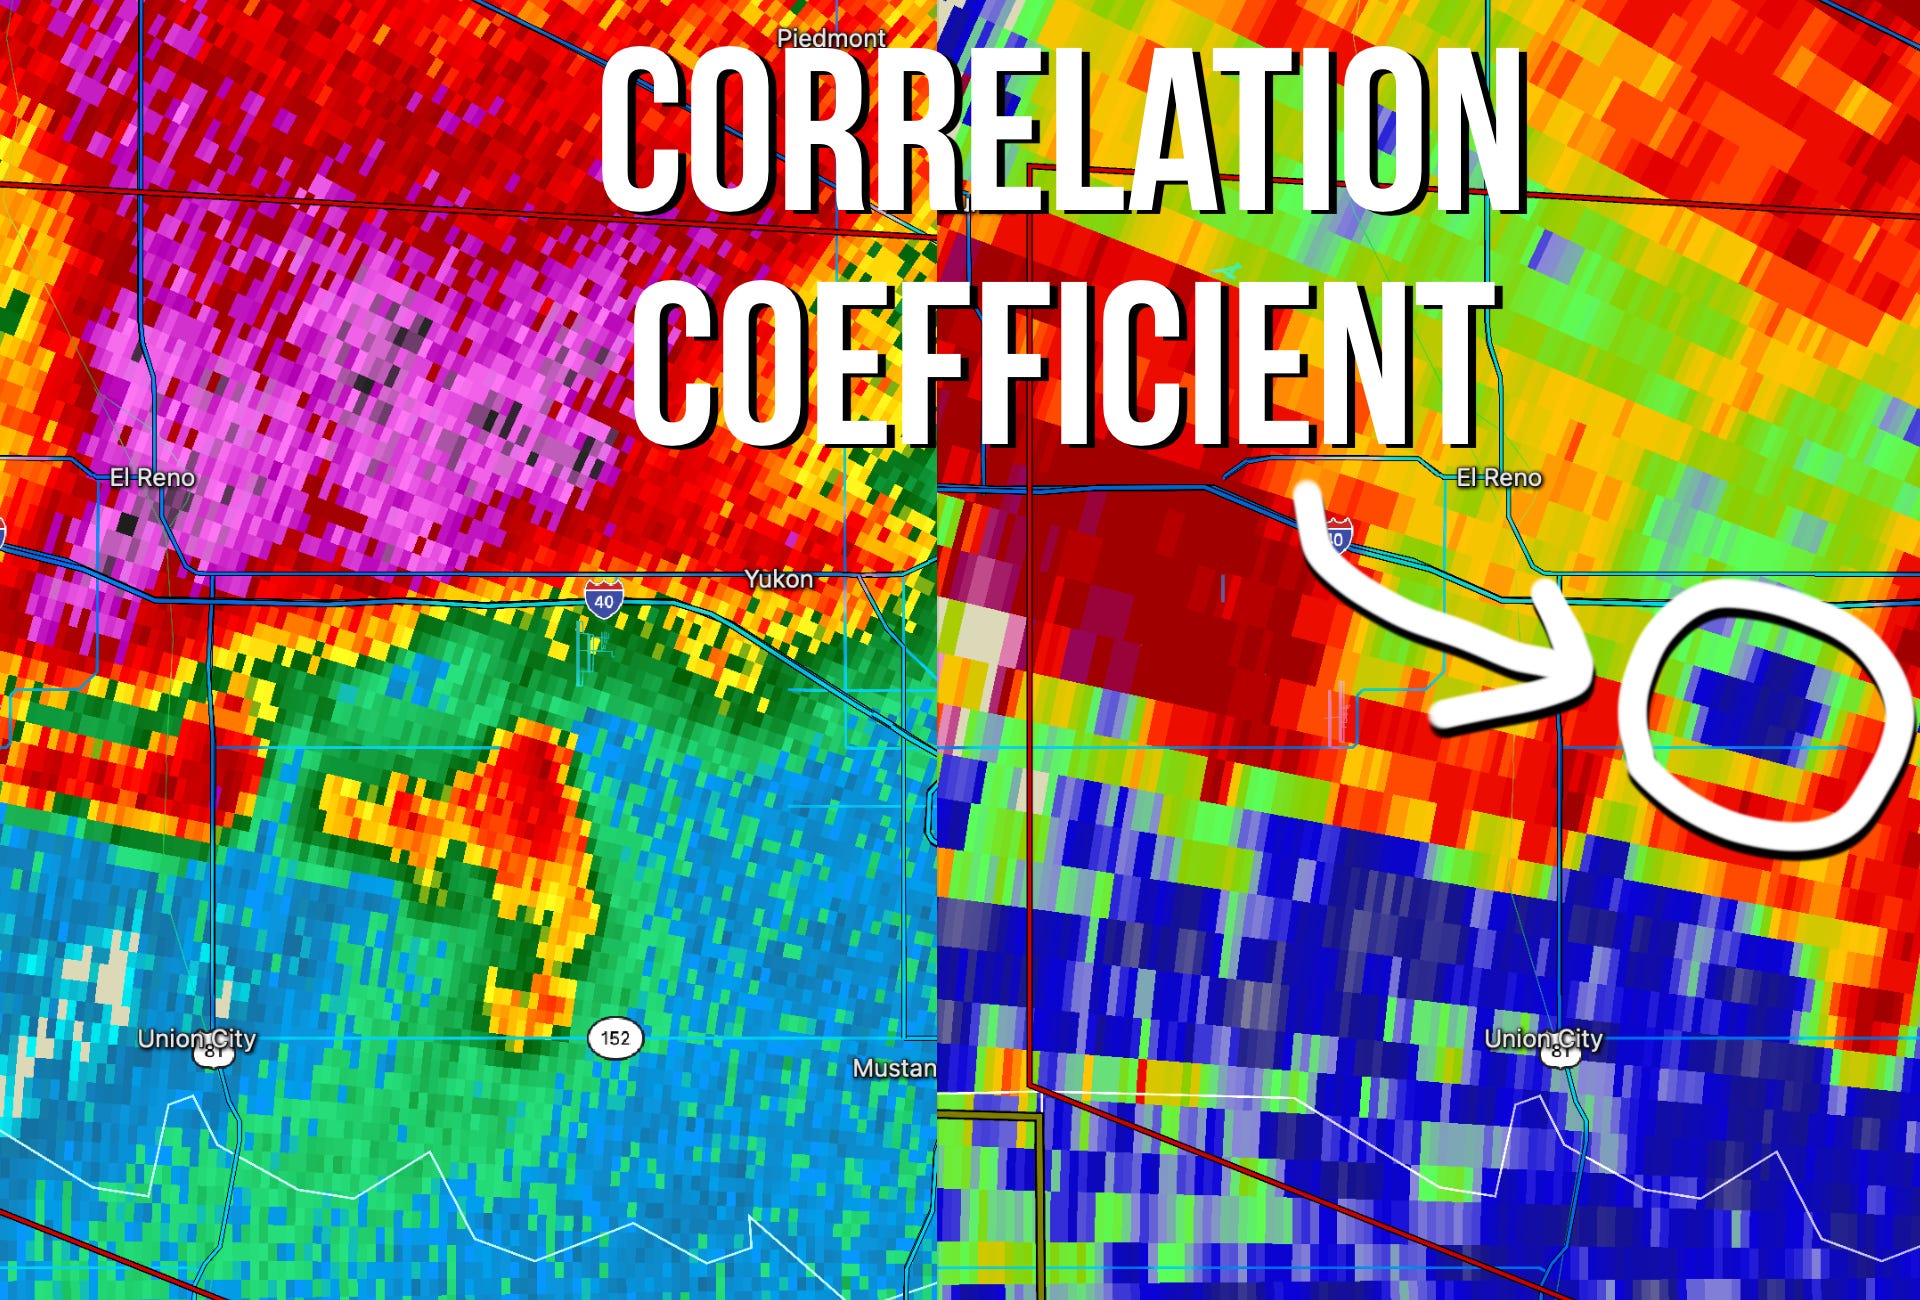
3. Correlation Coefficient: The Truth Machine
The Big Picture: CC measures the uniformity of objects. It’s the “Identity” product. If everything is rain, CC is near 1.0. If it’s a mix of mud, shingles, and fiberglass insulation, CC crashes.
Why it Matters
In the Plains, we have visibility in many cases. But sometimes, with HP storms or at night, we need another tool: correlation coefficient. It is the only way to move from “This looks like a tornado” to “There is definitely a tornado.”
The Field Use-Case: The Nighttime Reality Check
The Scenario: A rain-wrapped HP supercell is ongoing at 9 p.m. The velocity couplet looks dangerous, but no reliable storm reports are coming through due to the heavy rain surrounding the meso.
The Move: Toggle to CC and look for the Tornado Debris Signature (TDS).
The Result: A localized “blue” or “yellow” spot (CC < 0.8) co-located with your velocity couplet indicates that a tornado is ongoing.
The Deep Science: The Debris Column (Vertical Extent)
The “Pro” Signal: Don’t just look at the lowest scan. Tilt up and see how high that CC drop goes.
The “Why”: The height of a TDS (the debris column) is correlated with tornado intensity. If the CC drop is only visible on the lowest tilt of the radar, it’s likely a weak or short-lived tornado however, if you see that “debris hole” reaching 10,000, 15,000, or even 20,000 feet into the air, you are quite possibly looking at a violent, high-end tornado.